Free Job Chart Printables: Templates for Task Management
TL;DR: Job chart printables are downloadable templates that help organize tasks, responsibilities, and schedules for teams or households. These visual tools display assignments clearly, track progress, and improve accountability. Available in various formats like chore charts, shift schedules, and project trackers, they streamline workflow management without requiring complex software or digital platforms.
Frequently Asked Questions

What are job chart printables and how can they improve workplace organization?
Job chart printables are downloadable templates that help organize tasks, responsibilities, and schedules in visual formats. They improve workplace organization by providing clear task assignments, tracking progress, and ensuring accountability. These printables can include chore charts, duty rosters, task lists, and responsibility matrices that teams can customize and print for daily use in offices, manufacturing plants, or home environments.
How do job chart printables integrate with quality management systems (QMS)?
Job chart printables complement QMS by providing visual task tracking for quality control activities, audits, and corrective actions. While printables offer simple task management, modern QMS platforms digitize these processes with real-time updates, automated workflows, and KPI dashboards. Organizations transitioning from spreadsheets and manual charts to integrated QMS solutions gain better traceability, compliance documentation, and cross-plant visibility for quality management activities.
What key performance indicators (KPIs) should be tracked on job chart printables?
Essential KPIs for job chart printables include task completion rates, on-time performance, quality metrics, incident response times, and individual productivity measures. For manufacturing environments, track defect rates, corrective action completion, supplier claim resolution, and audit compliance. Modern digital platforms replace static printables with dynamic KPI dashboards that update in real-time, enabling better decision-making and performance monitoring across multiple plants and teams.
How can job chart printables support Lean and Six Sigma initiatives?
Job chart printables support Lean and Six Sigma by visualizing standardized work, tracking process improvements, and identifying waste. They help teams implement 5S organization, monitor DMAIC project phases, and document corrective actions. However, digital QRQC platforms offer superior capabilities by providing real-time incident management, automated data collection, and integrated analytics that accelerate continuous improvement efforts and reduce reliance on manual tracking methods.
What templates complement job chart printables for complete project management?
Complementary templates include to-do list templates for daily tasks, cover note templates for documentation, purchase order templates for procurement tracking, and invoice templates for financial records. For integrated program management, organizations benefit from combining these with corrective action forms, incident reports, and supplier claim documents. Modern platforms consolidate these separate printables into unified systems that eliminate redundant data entry and improve cross-functional collaboration.
Can job chart printables replace digital incident management systems?
Job chart printables cannot fully replace digital incident management systems, especially in multi-site operations. While printables work for basic task tracking, they lack real-time updates, automated notifications, and data analytics capabilities. Digital QRQC platforms provide instant incident reporting, supplier claim management, corrective action tracking, and KPI dashboards across all plants, eliminating the delays and errors associated with paper-based or spreadsheet systems.
How do you create effective job chart printables for manufacturing environments?
Create effective manufacturing job chart printables by including clear task descriptions, assigned responsibilities, completion deadlines, and quality checkpoints. Incorporate visual indicators like color coding, priority levels, and status markers. Include sections for corrective actions, incident notes, and supervisor sign-offs. For optimal results, transition to digital platforms that offer customizable templates with real-time synchronization, mobile access, and automated reporting capabilities that paper printables cannot provide.
What are the limitations of using job chart printables versus integrated management platforms?
Job chart printables have significant limitations including lack of real-time updates, difficulty tracking changes across multiple locations, no automated alerts, and poor data integration. They require manual updates, create version control issues, and don't support collaborative problem-solving. Integrated management platforms overcome these limitations by replacing spreadsheets and manual systems with real-time QRQC capabilities, centralized incident management, automated supplier claims processing, and unified KPI dashboards accessible across all facilities.
Introduction to Job Chart Printables for Modern Manufacturing Operations

In today's fast-paced manufacturing environment, maintaining clear task assignments and accountability is crucial for operational excellence. Job chart printables have emerged as essential tools for organizing responsibilities, tracking progress, and ensuring that every team member understands their role in maintaining quality standards. These visual management tools bridge the gap between strategic planning and daily execution, particularly in facilities where multiple shifts, departments, and quality control processes must coordinate seamlessly.
Whether you're managing a single production line or overseeing multi-plant operations, implementing effective job chart printables can transform how your team approaches daily tasks, incident response, and continuous improvement initiatives. This comprehensive guide explores how to create, implement, and optimize job chart printables specifically for manufacturing and quality management contexts.
Understanding Job Chart Printables in Manufacturing Contexts

Job chart printables are structured documents that outline specific tasks, responsibilities, and completion timelines for team members. In manufacturing settings, these charts serve multiple purposes beyond simple task assignment—they become integral components of your quality management system (QMS) and operational excellence framework.
Core Components of Effective Job Charts
A well-designed job chart includes several critical elements that ensure clarity and accountability:
- Task descriptions: Clear, actionable items that leave no room for interpretation
- Assigned personnel: Specific individuals or roles responsible for each task
- Completion deadlines: Realistic timeframes that align with production schedules
- Status indicators: Visual markers showing progress (not started, in progress, completed)
- Quality checkpoints: Integration with inspection protocols and corrective actions
These components work together to create a comprehensive visual management tool that supports both individual accountability and team coordination. For operations directors managing incident response and corrective actions, job charts become critical documentation that tracks resolution progress and prevents recurrence.
Creating Professional Job Chart Printables: Templates and Tools
Developing effective job chart printables requires understanding both the visual design principles that enhance usability and the content structure that supports operational needs. Let's explore the most effective approaches for creating these essential documents.
Template Options for Different Manufacturing Scenarios
Different operational contexts require different template approaches. Consider these options when developing your job chart printables:
| Template Type | Best Use Case | Key Features |
|---|---|---|
| Daily Task Checklist | Routine production operations | Hourly breakdowns, shift handoff sections, quality checkpoints |
| Corrective Action Tracker | Incident response management | Root cause analysis fields, responsible parties, verification steps |
| Multi-Plant Coordination Chart | Cross-facility quality initiatives | Location identifiers, standardized procedures, KPI tracking |
| Supplier Quality Chart | Vendor management and claims | Supplier details, issue categories, escalation protocols |
When creating templates from scratch, many manufacturing professionals turn to versatile tools. A canva invoice template can be adapted for job tracking by modifying the line item structure to represent tasks instead of products. Similarly, a standard to do list template provides an excellent starting point that can be enhanced with manufacturing-specific fields like safety requirements and quality standards.
Design Principles for Maximum Usability
The visual design of your job chart printables directly impacts their effectiveness on the factory floor. Apply these principles to ensure your charts are both functional and user-friendly:
- High contrast: Use bold text and clear color coding that remains visible in various lighting conditions
- Logical flow: Arrange tasks in chronological or process-sequential order
- Adequate spacing: Provide room for handwritten notes and checkmarks
- Durable format: Design for lamination or protective sleeves to withstand shop floor conditions
Consider incorporating elements from a bubble letter template printable approach for headers and critical safety warnings—larger, bolder text ensures important information catches attention even in busy production environments.
Integrating Job Charts with Quality Management Systems
For manufacturing quality managers overseeing multi-plant operations, job chart printables must integrate seamlessly with broader quality management initiatives. This integration ensures that task completion contributes directly to organizational quality objectives and continuous improvement efforts.
Connecting Job Charts to Key Performance Indicators
Understanding what are key performance indicators (KPIs) in your specific manufacturing context allows you to design job charts that capture data supporting these metrics. When team members complete tasks on their job charts, they're simultaneously contributing to KPI measurement and improvement.
Common KPIs that job chart printables can support include:
- First Pass Yield: Track quality checks and inspection results directly on task charts
- On-Time Task Completion: Monitor adherence to scheduled maintenance and quality audits
- Incident Response Time: Document timestamps for corrective action initiation and completion
- Supplier Quality Metrics: Record incoming inspection results and claim processing activities
Plant managers tracking quality KPIs across facilities benefit from standardized job chart formats that enable cross-location comparison and benchmarking. This standardization is a core principle of lean and six sigma methodologies, where consistent measurement enables meaningful process improvement.
QMS Quality Management System Integration
A robust QMS quality management system requires documentation that demonstrates compliance, tracks corrective actions, and supports continuous improvement. Job chart printables serve as primary documentation in this system, providing evidence of:
- Preventive maintenance completion
- Calibration and verification activities
- Training and competency assessments
- Audit findings and corrective action implementation
When designing job charts for QMS integration, include fields for signatures, timestamps, and reference numbers that link to other quality documentation. This creates an audit trail that quality auditors can follow to verify system effectiveness.
Implementing Integrated Program Management Through Job Charts
Integrated program management requires coordination across multiple functions, locations, and improvement initiatives. Job chart printables become coordination tools that ensure everyone understands how their daily tasks contribute to larger strategic objectives.
Cross-Functional Coordination
Supply chain professionals handling supplier quality issues need visibility into production schedules, incoming inspection tasks, and corrective action timelines. Job charts designed with cross-functional visibility enable this coordination by clearly showing:
- Dependencies between departments (e.g., quality approval needed before production release)
- Handoff points where responsibility transfers between teams
- Escalation triggers when issues require management attention
- Communication requirements for status updates and issue resolution
Consider creating specialized job charts that span multiple departments, similar to how a purchase order template in word tracks information flow between purchasing, receiving, and accounts payable. This multi-departmental approach ensures nothing falls through the cracks during complex processes.
Multi-Plant Standardization Strategies
For operations directors managing multiple facilities, standardized job chart printables ensure consistent execution of quality procedures regardless of location. This standardization supports:
| Benefit Category | Specific Advantages | Implementation Consideration |
|---|---|---|
| Training Efficiency | Employees transferring between plants face minimal learning curve | Include plant-specific variations in clearly marked sections |
| Performance Comparison | Apples-to-apples benchmarking across locations | Ensure consistent metrics and measurement methods |
| Best Practice Sharing | Successful processes easily replicated at other sites | Build in feedback mechanisms for continuous improvement |
| Audit Readiness | Consistent documentation simplifies compliance verification | Maintain version control and update distribution processes |
Specialized Job Chart Applications in Manufacturing
Beyond general task management, job chart printables can be customized for specific manufacturing scenarios that require specialized tracking and documentation.
Incident Management and Corrective Action Tracking
When quality incidents occur, rapid response and thorough documentation are critical. Incident-specific job charts guide teams through structured problem-solving approaches while ensuring nothing is overlooked:
- Immediate containment actions: Isolate affected product, secure evidence, notify stakeholders
- Root cause investigation: Gather data, interview personnel, analyze process deviations
- Corrective action development: Identify solutions, assign implementation responsibilities, set deadlines
- Verification and validation: Confirm effectiveness, update procedures, communicate lessons learned
These incident response job charts function similarly to a cover note template that accompanies incident reports—they provide context, track progress, and ensure all required information is captured for management review and regulatory compliance.
Supplier Quality and Claims Management
Supply chain professionals handling supplier quality issues benefit from specialized job charts that track the entire supplier claim lifecycle. These charts include:
- Supplier identification and contact information
- Issue description with photo documentation placeholders
- Disposition decisions (return, rework, use-as-is with concession)
- Supplier corrective action requests and responses
- Financial claim tracking and resolution status
This structured approach ensures supplier quality issues are resolved systematically and that supplier performance data is captured for ongoing vendor management decisions.
Enhancing Job Charts with Visual Management Techniques
Visual management principles from lean manufacturing can significantly enhance the effectiveness of job chart printables. These techniques make status information immediately apparent to anyone viewing the chart, supporting transparency and rapid decision-making.
Color Coding and Status Indicators
Implement a consistent color coding system across all job charts to enable at-a-glance status assessment:
- Green: Completed on time with quality standards met
- Yellow: In progress with potential concerns or approaching deadline
- Red: Overdue, blocked, or quality issue identified
- Blue: Scheduled but not yet started
This approach mirrors the visual clarity found in well-designed pumpkin carving templates print materials, where different shading patterns guide users through complex patterns. In manufacturing contexts, this visual clarity enables supervisors to quickly identify areas needing attention during gemba walks.
Incorporating Lean Principles
The principles of lean and six sigma emphasize waste elimination and process efficiency. Apply these principles to job chart design by:
- Eliminating redundancy: Remove duplicate data entry by referencing other documents rather than recopying information
- Standardizing work: Use consistent terminology and formats across all job charts
- Visual workplace: Position job charts at the point of use where tasks are performed
- Pull systems: Design charts that trigger next actions when previous tasks complete
These lean principles ensure your job chart printables add value rather than becoming another form of non-value-added paperwork that teams view as bureaucratic burden.
Digital Transformation: From Printables to Integrated Platforms
While job chart printables remain valuable tools, particularly in environments where digital devices are impractical, many manufacturing operations are transitioning to integrated digital platforms that offer enhanced functionality.
Limitations of Paper-Based Job Charts
Traditional printable job charts face several challenges in modern manufacturing environments:
- Real-time visibility gaps: Managers can't see status updates until physically reviewing paper charts
- Data analysis difficulties: Extracting trends and patterns requires manual data entry and compilation
- Version control issues: Ensuring everyone uses current templates becomes challenging
- Communication delays: Relying on WhatsApp or email to share updates creates fragmentation
- Archival and retrieval: Finding historical job charts for trend analysis or audits is time-consuming
The Evolution to Digital QRQC Platforms
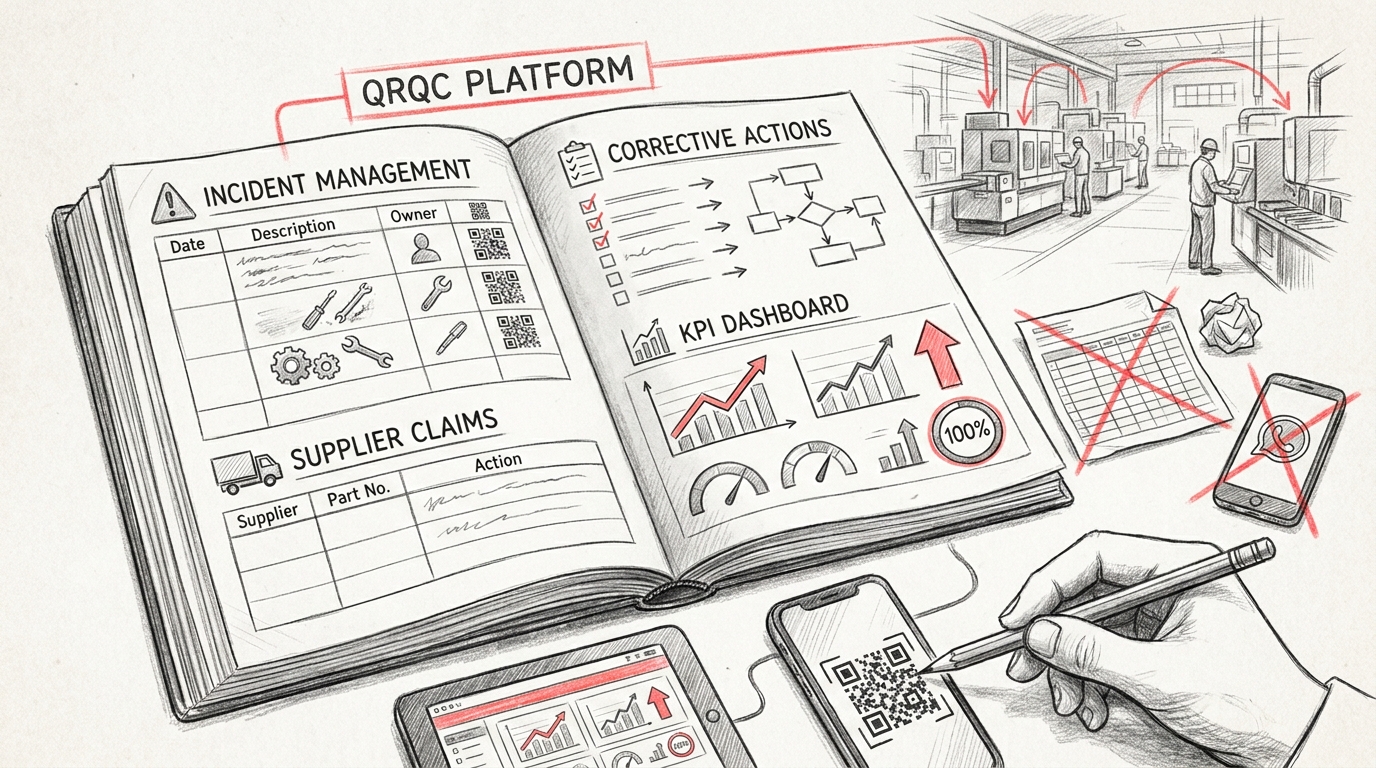
Modern manufacturing operations are replacing spreadsheets and WhatsApp with comprehensive digital platforms designed specifically for quality management and incident response. These platforms maintain the visual clarity and structured approach of traditional job chart printables while adding powerful capabilities.
A dedicated QRQC — Industrial Quality Control Software platform provides real-time incident management, supplier claims tracking, corrective action workflows, and KPI dashboards across every plant in your network. This digital transformation doesn't eliminate the principles that make job charts effective—it enhances them with connectivity, analytics, and automation.
For organizations exploring lean operations tools, the transition from printable job charts to integrated digital platforms represents a natural evolution that preserves proven methodologies while eliminating the limitations of paper-based systems.
Best Practices for Job Chart Implementation and Maintenance
Successful job chart implementation requires more than just creating templates—it demands thoughtful rollout, training, and continuous improvement processes.
Rollout Strategy for New Job Charts
When introducing new job chart printables or updating existing formats, follow this structured approach:
- Pilot testing: Trial the new format with a single shift or department before full deployment
- Gather feedback: Ask frontline users what works, what's confusing, and what's missing
- Refine and iterate: Make adjustments based on real-world usage before broader rollout
- Train thoroughly: Don't assume the chart is self-explanatory—provide hands-on training
- Leadership support: Ensure supervisors and managers actively use and reference the charts
Continuous Improvement and Updates
Job charts should evolve as your processes improve and business needs change. Establish a regular review cycle—quarterly or semi-annually—to assess effectiveness and identify enhancement opportunities.
Consider these questions during reviews:
- Are all fields being used, or are some consistently left blank?
- Have new tasks emerged that should be added to the chart?
- Are completion rates improving or declining over time?
- What feedback have users provided about usability and clarity?
This continuous improvement approach aligns with the broader principles of integrated program management, where regular assessment and adjustment ensure tools remain relevant and valuable.
Measuring the Impact of Job Chart Printables
To justify the time invested in creating and maintaining job chart printables, manufacturing leaders need to measure their impact on operational performance and quality outcomes.
Metrics for Assessing Job Chart Effectiveness
Track these metrics to quantify the value your job chart system delivers:
| Metric | Measurement Method | Target Improvement |
|---|---|---|
| Task Completion Rate | Percentage of assigned tasks completed on time | 95% or higher |
| Incident Response Time | Hours from detection to corrective action initiation | Reduce by 30-50% |
| Documentation Compliance | Percentage of required fields completed on job charts | 100% for critical fields |
| Quality Escape Rate | Number of defects reaching customers | Continuous reduction trend |
These metrics provide objective evidence of job chart value and help identify specific areas where the system can be strengthened. For plant managers tracking quality KPIs across facilities, this data enables meaningful comparison of how effectively different locations utilize job chart systems.
Conclusion: Building a Foundation for Operational Excellence
Job chart printables represent more than simple task lists—they're foundational tools for building accountability, ensuring quality, and driving continuous improvement in manufacturing operations. From daily production checklists to complex incident response tracking, well-designed job charts provide the structure that transforms individual tasks into coordinated operational excellence.
As you implement or refine your job chart system, remember that the most effective approaches balance standardization with flexibility, visual clarity with comprehensive information capture, and paper-based accessibility with digital enhancement opportunities. Whether you're a manufacturing quality manager overseeing multi-plant operations or a plant supervisor managing a single shift, investing in thoughtfully designed job chart printables pays dividends in improved quality, faster problem resolution, and stronger team accountability.
For organizations ready to move beyond spreadsheets and fragmented communication tools, modern digital platforms offer the next evolution in job tracking and quality management. Visit our website to discover how a dedicated QRQC platform can transform your approach to incident management, supplier claims, corrective actions, and KPI tracking across every plant in your network. Replace disconnected tools with real-time visibility and integrated workflows that build on the proven principles of effective job chart management while eliminating the limitations of paper-based systems.
Article created using IntentRank