Digital Poster Board Presentations: Modern Quality Tools
TL;DR: A poster board presentation is a visual display method using large foam boards to communicate information, data, or project results through text, charts, images, and graphics. Common in academic, scientific, and business settings, these presentations enable presenters to share key findings while engaging audiences through organized, easy-to-read visual layouts that facilitate discussion and knowledge transfer.
Frequently Asked Questions

What is a poster board presentation and when should you use it?
A poster board presentation is a visual display method using large boards to showcase information, data, and graphics in an organized format. It's commonly used for science fairs, business conferences, project updates, and quality management reviews. Organizations use poster boards to present KPIs, process improvements, and project milestones in manufacturing environments where real-time visual communication is essential for team alignment and decision-making.
How do you create an effective poster board presentation for quality management systems?
Create an effective QMS poster board by organizing content into clear sections: title, problem statement, data analysis, and corrective actions. Use templates to maintain consistency, incorporate KPI dashboards with visual charts, and include key metrics like defect rates or process improvements. Integrate Six Sigma methodologies and QRQC principles. Digital platforms can replace traditional poster boards, enabling real-time updates across multiple plants and eliminating manual spreadsheet tracking.
What are the key elements to include in a poster board presentation template?
Essential elements include a clear title, objective statement, methodology section, data visualization area, results summary, and conclusions. For business contexts, add KPI dashboards, incident management timelines, supplier claim details, and corrective action plans. Include space for charts, graphs, and tables. Use consistent fonts, colors, and layouts. Templates should accommodate both printed formats and digital displays for integrated program management across facilities.
How can poster board presentations improve incident management and corrective actions?
Poster boards visualize incident timelines, root cause analysis, and corrective action progress, making complex data accessible to all team members. They facilitate QRQC meetings by displaying real-time status updates, supplier claims, and resolution steps. Digital poster board platforms eliminate communication gaps from spreadsheets and WhatsApp, providing centralized tracking across plants. This transparency accelerates problem-solving and ensures accountability in quality management systems.
What is the difference between traditional poster boards and digital presentation platforms?
Traditional poster boards are physical displays requiring manual updates, printing, and on-site viewing. Digital platforms offer real-time collaboration, automatic data integration from KPI dashboards, instant updates across multiple locations, and accessible archives. Digital solutions eliminate version control issues common with spreadsheets, enable remote team participation, and provide analytics on corrective actions and supplier performance. They're ideal for integrated program management in multi-plant operations.
How do you integrate KPIs and Lean Six Sigma metrics into poster board presentations?
Integrate KPIs by creating dedicated dashboard sections showing metrics like cycle time, defect rates, OEE, and cost savings. Use visual indicators (red/yellow/green) for quick status assessment. Include Lean Six Sigma tools like control charts, Pareto diagrams, and process capability indices. Display before-and-after comparisons to demonstrate improvement impact. Real-time digital platforms automatically update these metrics from your QMS, eliminating manual data entry and ensuring accuracy.
What are the best practices for designing a professional poster board presentation?
Best practices include using a clear hierarchy with large, readable fonts; limiting text to essential information; incorporating high-contrast colors for visibility; using charts and graphs over dense paragraphs; maintaining consistent branding; and organizing content in logical flow (left-to-right, top-to-bottom). Leave white space to avoid clutter. For quality management contexts, standardize templates across departments to facilitate comparison and ensure all critical elements like corrective actions and supplier claims are consistently documented.
How can poster board presentations replace spreadsheets and messaging apps in quality management?
Poster board platforms centralize incident tracking, supplier claims, and corrective actions in one visual system, replacing scattered spreadsheets and WhatsApp conversations. They provide structured workflows, automated notifications, real-time KPI dashboards, and audit trails that messaging apps cannot offer. Teams access consistent, updated information across all plants simultaneously, eliminating version confusion and communication delays. This transformation improves accountability, traceability, and response times in QMS operations.
Introduction to Poster Board Presentations in Industrial Quality Management

A poster board presentation remains one of the most effective visual communication tools in manufacturing environments, quality management systems, and industrial operations. Whether you're presenting quality metrics at a gemba walk, displaying corrective action results, or showcasing continuous improvement initiatives, poster boards provide immediate visual impact that digital displays sometimes cannot match.
In modern manufacturing facilities, poster board presentations serve as critical communication hubs for quality control teams, plant managers, and operations directors. They bridge the gap between data collection and actionable insights, making complex quality metrics accessible to everyone on the shop floor.
This comprehensive guide explores how to create impactful poster board presentations that drive quality improvements, enhance team communication, and support lean manufacturing principles across your operations.
Understanding the Role of Poster Board Presentations in Quality Management

Why Poster Boards Matter in Manufacturing Environments
Manufacturing facilities face unique communication challenges. Teams work across multiple shifts, quality issues require immediate visibility, and data needs to be accessible without requiring login credentials or device access. Poster board presentations address these challenges effectively.
Unlike digital dashboards that require screens and power sources, poster boards provide persistent visibility. They serve as constant reminders of quality objectives, safety protocols, and performance metrics that teams encounter throughout their shifts.
- Immediate visual impact without technology barriers
- Accessible to all team members regardless of digital literacy
- Persistent visibility across shift changes
- Cost-effective compared to digital display systems
- Easy to update and modify based on current priorities
Integration with Digital Quality Management Systems
Modern quality management approaches don't require choosing between physical and digital tools. The most effective operations integrate both. A QMS quality management system can generate data that feeds into poster board presentations, creating a hybrid approach that maximizes accessibility and impact.
This integration supports integrated program management by ensuring that digital incident tracking, corrective actions, and KPI monitoring translate into visible shop floor communication. Teams can see real-time quality metrics without needing to access computer systems during production hours.
Essential Components of an Effective Poster Board Presentation
Layout and Visual Hierarchy
The foundation of any successful poster board presentation lies in its visual structure. Manufacturing environments are busy, distracting spaces where attention is limited. Your poster board must communicate key information in seconds, not minutes.
Start with a clear hierarchy that guides the eye from most important to supporting information. Use size, color, and positioning to create this hierarchy naturally.
| Element | Priority Level | Recommended Size | Purpose |
|---|---|---|---|
| Title/Header | Highest | 3-4 inches | Immediate topic identification |
| Key Metrics/KPIs | High | 2-3 inches | Primary data communication |
| Supporting Charts | Medium | 1/4 to 1/3 of board | Trend visualization |
| Action Items | High | 1.5-2 inches | Next steps clarity |
| Context/Details | Low | 0.5-1 inch | Background information |
Understanding What Are Key Performance Indicators KPIs
When creating poster board presentations for quality management, understanding what are key performance indicators KPIs becomes essential. KPIs are measurable values that demonstrate how effectively your organization achieves key business objectives.
In quality management contexts, relevant KPIs include defect rates, first-pass yield, customer complaint frequency, corrective action closure rates, and supplier quality metrics. Your poster board should highlight 3-5 critical KPIs rather than overwhelming viewers with excessive data.
- First Pass Yield (FPY) - percentage of products manufactured correctly without rework
- Defects Per Million Opportunities (DPMO) - standardized defect measurement
- Customer Complaint Rate - frequency and severity of customer issues
- Corrective Action Cycle Time - speed of issue resolution
- Supplier Quality Index - performance metrics for incoming materials
Templates and Standardization
Consistency across poster board presentations creates familiarity and reduces cognitive load. When plant managers and quality teams know where to look for specific information, communication becomes more efficient.
Consider developing standardized templates similar to a cover note template or to do list template that maintains consistent structure while allowing customization for specific content. This approach mirrors how organizations use standardized templates like canva invoice template or purchase order template in word to maintain professional consistency.
Template elements should include designated areas for titles, date ranges, responsible parties, current status, trends, and action items. Color coding can indicate status at a glance—green for on-target, yellow for caution, red for immediate attention required.
Creating Poster Board Presentations for Lean and Six Sigma Initiatives
Aligning with Lean Manufacturing Principles
Organizations implementing lean and six sigma methodologies benefit significantly from well-designed poster board presentations. These visual management tools support lean principles by making problems visible, facilitating quick response, and maintaining focus on continuous improvement.
Lean manufacturing emphasizes visual management as a core principle. Poster boards serve as visual controls that make abnormal conditions immediately apparent. When quality metrics deviate from targets, the visual representation on a poster board triggers immediate investigation and response.
For more comprehensive digital support of lean operations, explore lean operations tools that complement physical visual management systems.
Six Sigma Project Tracking
Six Sigma projects follow the DMAIC methodology (Define, Measure, Analyze, Improve, Control). Poster boards can effectively track project progress through each phase, displaying current status, key findings, and next steps.
| DMAIC Phase | Poster Board Content | Key Metrics |
|---|---|---|
| Define | Problem statement, project scope, team members | Project charter approval, stakeholder sign-off |
| Measure | Current state metrics, data collection plan | Baseline defect rates, process capability |
| Analyze | Root cause analysis, fishbone diagrams, Pareto charts | Identified root causes, validation data |
| Improve | Solution proposals, pilot results, implementation plan | Improvement delta, cost-benefit analysis |
| Control | Control plan, monitoring schedule, handoff documentation | Sustained improvement metrics, control limits |
Design Principles for Maximum Impact
Color Psychology and Visual Coding
Color selection significantly impacts how quickly and accurately viewers interpret your poster board presentation. In manufacturing quality management, color conventions carry specific meanings that should be respected and reinforced.
Red universally signals problems, stop conditions, or critical issues requiring immediate attention. Green indicates acceptable performance, on-target metrics, or completed actions. Yellow or amber represents caution, borderline performance, or items requiring monitoring.
- Red: Critical issues, safety hazards, out-of-spec conditions
- Yellow/Amber: Warnings, approaching limits, items requiring attention
- Green: Acceptable performance, completed items, safe conditions
- Blue: Information, process flow, standard procedures
- Black: Text, labels, permanent information
Typography and Readability
Text on poster boards must be readable from the intended viewing distance. In manufacturing environments, viewers may stand 6-10 feet away from the board. This distance requirement dictates minimum font sizes and style choices.
Sans-serif fonts like Arial, Helvetica, or Calibri provide better readability at distance than serif fonts. Bold weights enhance visibility without requiring larger sizes. Avoid decorative fonts entirely—clarity trumps creativity in industrial settings.
As a general rule, title text should be at least 1 inch tall, primary content should be 0.5-0.75 inches, and supporting details should never drop below 0.25 inches. If information requires smaller text, it likely belongs in supporting documentation rather than on the poster board.
Data Visualization Best Practices
Charts and graphs transform raw numbers into actionable insights. The right visualization makes trends, patterns, and outliers immediately apparent. The wrong visualization obscures important information and wastes valuable board space.
Line charts effectively show trends over time—perfect for tracking defect rates, yield percentages, or cycle times across weeks or months. Bar charts compare discrete categories like defect types, production lines, or shift performance. Pie charts should be used sparingly and only when showing parts of a whole where proportions matter more than absolute values.
Practical Applications Across Manufacturing Operations
Daily Management Systems and Tier Meetings
Poster boards serve as focal points for daily tier meetings where teams review performance, identify issues, and assign corrective actions. These structured meetings follow a consistent format, with the poster board providing visual structure and ensuring all critical topics receive attention.
A well-designed daily management board includes sections for safety incidents, quality metrics, production targets, equipment status, and action item tracking. Teams can update information quickly between shifts, maintaining current visibility for all stakeholders.
QRQC Boards for Rapid Problem Solving
Quick Response Quality Control (QRQC) methodology relies heavily on visual management. QRQC poster boards display current quality issues, containment actions, root cause analyses, and corrective action plans. This visibility ensures problems don't get lost in email chains or forgotten in digital systems.
Organizations implementing QRQC benefit from combining physical boards with digital quality control software that captures incident details, tracks corrective actions, and generates metrics for board display. This hybrid approach maintains visibility while ensuring data integrity and traceability.
Supplier Quality Management
Supply chain professionals handling supplier quality issues use poster boards to track incoming material quality, supplier scorecards, and corrective action requests. Visual management makes supplier performance transparent to receiving teams, quality inspectors, and production personnel.
Boards might display current supplier rankings, open quality issues by supplier, containment actions for defective materials, and trends in incoming quality metrics. This visibility drives accountability and facilitates rapid response when supplier issues impact production.
Step-by-Step Guide to Creating Your Poster Board Presentation
Planning and Content Development
Effective poster boards begin with clear objectives. Before selecting materials or designing layouts, answer fundamental questions about purpose, audience, and desired outcomes.
- Define the primary purpose: What decision or action should this board support?
- Identify the audience: Who will view this board and what's their knowledge level?
- Determine update frequency: How often will information change?
- Establish ownership: Who is responsible for maintaining accuracy?
- Set success metrics: How will you know if the board is effective?
Once objectives are clear, gather the data and information that will populate the board. Focus on information that drives decisions rather than comprehensive documentation. Remember that supporting details can be referenced in linked systems rather than crowding the physical board.
Material Selection and Assembly
Material choices impact durability, updateability, and visual appeal. Manufacturing environments present challenges including dust, temperature variations, and physical contact that influence material selection.
Foam core boards provide lightweight, cost-effective bases for temporary or frequently changing displays. Magnetic whiteboards offer maximum flexibility for daily updates and reusable components. Laminated materials withstand harsh environments and allow dry-erase updates.
- Foam core: Lightweight, inexpensive, suitable for temporary displays
- Magnetic whiteboard: Reusable, flexible, ideal for daily updates
- Laminated surfaces: Durable, cleanable, protects printed materials
- Cork board: Good for pinned materials, less professional appearance
- Acrylic holders: Protect documents while allowing easy replacement
Layout Design and Assembly
With materials selected and content prepared, layout design brings everything together. Start with rough sketches that establish information placement before committing to final assembly.
Create a visual hierarchy that guides viewers through information logically. Most viewers scan from top-left to bottom-right, so position critical information accordingly. Use borders, color blocks, or spacing to group related information and separate distinct topics.
Much like using a bubble letter template printable or pumpkin carving templates print provides structure for creative projects, poster board templates provide structure while allowing customization. Develop reusable layouts that maintain consistency across multiple boards or locations.
Maintaining and Updating Poster Board Presentations
Establishing Update Protocols
Outdated information destroys credibility faster than any design flaw. Establish clear protocols for who updates information, when updates occur, and how accuracy is verified.
Daily management boards require daily updates—typically at shift changes or during tier meetings. Weekly or monthly boards should have designated update days with backup personnel identified to ensure continuity during absences.
Digital systems supporting poster boards can automate data collection and generate updated charts automatically. This automation reduces manual effort while improving accuracy and consistency.
Quality Checks and Verification
Implement verification processes to catch errors before they mislead decision-making. Simple checks include comparing board data to source systems, having a second person review updates, and establishing audit schedules where leadership verifies board accuracy.
Document update procedures clearly, similar to how organizations document processes using standardized templates. This documentation ensures consistency across shifts and personnel changes.
Common Mistakes to Avoid
Information Overload
The most common poster board mistake is attempting to include too much information. Cramped layouts with small text and excessive details overwhelm viewers rather than informing them.
Resist the temptation to use every available inch of space. White space improves readability and draws attention to important elements. If you can't fit information legibly, either reduce content or increase board size.
Inconsistent Updates
Nothing undermines poster board credibility faster than stale data. Teams quickly learn to ignore boards that show last week's or last month's information. Once credibility is lost, regaining trust requires sustained effort.
If maintaining manual updates proves challenging, consider digital displays or automated quality management systems that refresh automatically while maintaining visual accessibility.
Lack of Context
Numbers without context provide little value. A defect rate of 2.5% might be excellent or terrible depending on targets, history, and industry standards. Always include reference points like targets, historical averages, or benchmarks.
- Include target lines or reference values on charts
- Show trends over time, not just current values
- Provide brief explanations for significant changes
- Indicate measurement units clearly
- Define acronyms and technical terms
Integrating Digital and Physical Visual Management
The Hybrid Approach
Modern quality management doesn't require choosing between digital systems and physical poster boards. The most effective approaches integrate both, leveraging the strengths of each medium.
Digital systems excel at data collection, analysis, traceability, and multi-site visibility. Physical poster boards excel at immediate visibility, accessibility without technology barriers, and persistent presence in work areas.
Organizations implementing integrated program management across multiple facilities benefit from digital systems that centralize data while local poster boards provide site-specific visibility. This approach ensures plant managers and operations directors can track performance across facilities while shop floor teams focus on local metrics.
Automated Data Feeds
Technology can reduce the manual effort required to maintain poster boards. Print updated charts automatically from your QMS quality management system, generate QR codes linking to detailed data, or use digital displays for information that changes frequently while reserving poster boards for stable reference information.
This automation ensures consistency between digital records and physical displays, reducing errors and saving time. Teams can focus on analyzing data and taking action rather than manually updating displays.
Measuring Poster Board Effectiveness
Key Effectiveness Indicators
How do you know if your poster board presentations are working? Effective visual management should drive observable changes in behavior, decision-making, and outcomes.
| Metric | Measurement Method | Target |
|---|---|---|
| Viewing frequency | Observation during shifts | Multiple views per shift by team members |
| Discussion generation | Count of conversations referencing board data | Daily discussions during tier meetings |
| Action item closure | Track completion rates of displayed actions | 90%+ completion within timeframes |
| Decision speed | Time from issue identification to response | Reduction in response time vs. baseline |
| Information accuracy | Audit findings comparing board to source data | 100% accuracy with current data |
Continuous Improvement
Poster boards themselves should be subject to continuous improvement. Regularly solicit feedback from users about what works, what's confusing, and what's missing. Test layout changes, try different visualizations, and measure whether changes improve effectiveness.
This iterative approach mirrors lean and six sigma principles—plan, do, check, act. Your visual management system should evolve based on data about what drives better outcomes.
Advanced Applications and Future Trends
Multi-Site Standardization
Manufacturing organizations operating multiple plants face the challenge of maintaining consistent visual management across locations. Standardized poster board formats enable operations directors to quickly assess performance when visiting different facilities.
Develop corporate standards that specify layouts, metrics, and update frequencies while allowing sites to customize content for local issues. This balance provides consistency without sacrificing relevance.
Augmented Reality Integration
Emerging technologies are creating new possibilities for poster board presentations. Augmented reality applications can overlay additional information when users scan boards with mobile devices, providing detailed data without cluttering physical displays.
QR codes offer a simpler bridge between physical and digital, linking poster board summaries to detailed dashboards, corrective action records, or training materials. This layered approach provides immediate visibility for routine monitoring while making detailed information accessible when needed.
Sustainability Considerations
Environmental responsibility extends to visual management practices. Consider reusable materials, digital displays for frequently changing information, and recyclable components when boards reach end-of-life.
Laminated materials with dry-erase surfaces reduce paper consumption compared to printing new charts daily. Magnetic components can be reused indefinitely. Digital displays eliminate printing entirely while maintaining visibility, though they require energy and have their own environmental impacts.
Conclusion: Driving Quality Excellence Through Visual Management
Poster board presentations remain powerful tools for manufacturing quality management despite—or perhaps because of—their simplicity. They provide immediate visibility, require no technology barriers, and create persistent reminders of quality objectives that digital systems cannot match.
The most effective quality management approaches integrate physical poster boards with robust digital systems. This hybrid strategy leverages the accessibility and visibility of poster boards while maintaining the data integrity, traceability, and analytical capabilities of modern software platforms.
Whether you're tracking key performance indicators, managing supplier quality issues, coordinating corrective actions, or implementing lean and six sigma initiatives, well-designed poster board presentations transform data into action. They make problems visible, facilitate rapid response, and maintain focus on continuous improvement.
Success requires attention to design principles, commitment to accurate updates, and willingness to continuously improve based on effectiveness data. When implemented thoughtfully, poster board presentations become more than communication tools—they become drivers of cultural change toward quality excellence.
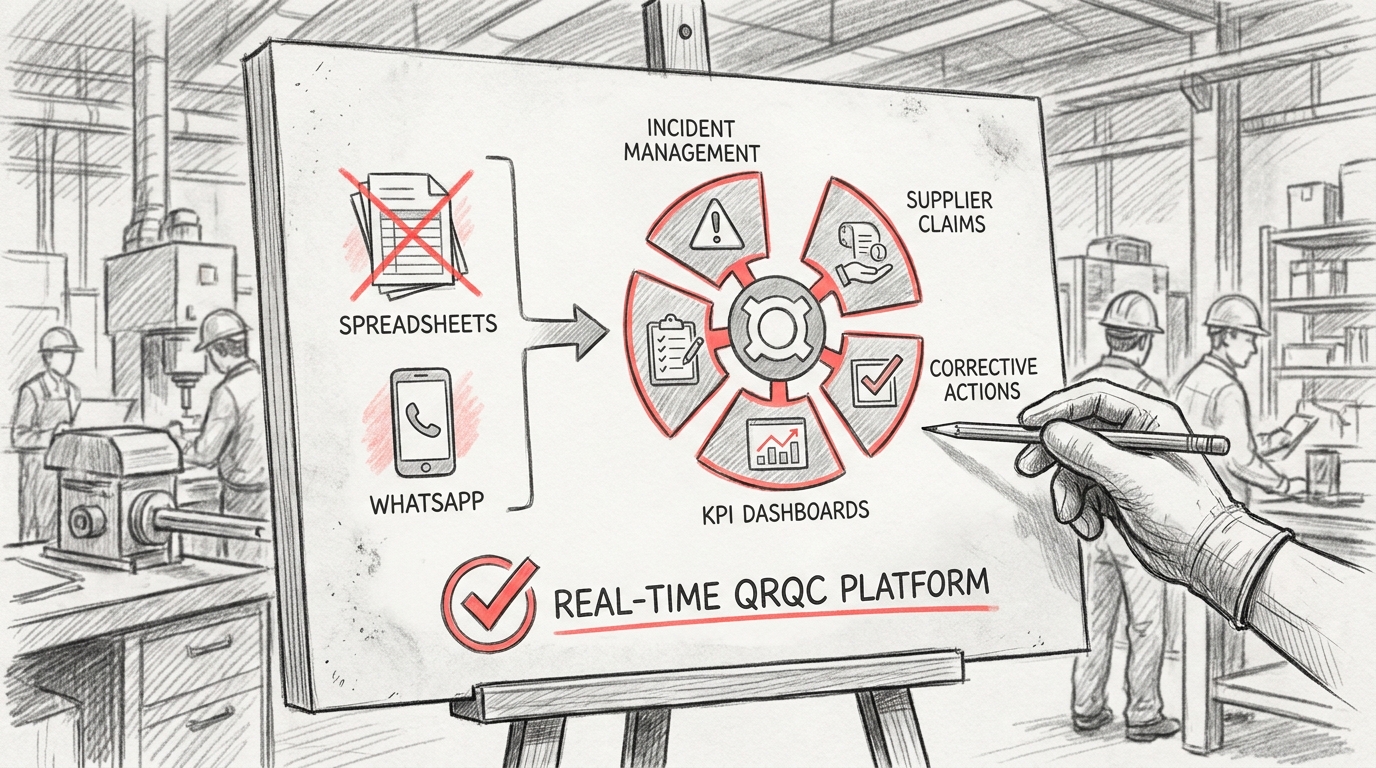
Ready to transform your quality management approach? Visit our website to discover how digital QRQC platforms complement visual management systems, replacing spreadsheets and fragmented communication with real-time incident management, supplier claims tracking, corrective actions, and KPI dashboards across every plant. See how integrated program management can elevate your quality operations while maintaining the visual accessibility that makes poster boards effective.
Article created using IntentRank